 FXLORDS Increase Your Profits

The Doji is pattern often found at the bottom and top of trends and thus is considered as a sign of possible reversal of price direction. The Doji is a powerful Candlestick formation, signifying indecision between bulls and bears It is characterized be the equal opening price and closing prices.
A doji is not as significant if the market is not clearly trending, as non-trending markets are inherently indicative of indecision. If the doji forms in an uptrend or downtrend, this is normally seen as significant, as it is a signal that the buyers are losing conviction when found in an uptrend and a signal that sellers are losing conviction if found in a downtrend.
The creation of the Doji pattern illustrates why the Doji represents such indecision. After the open, bulls push prices higher only for prices to be rejected and pushed lower by the bears. However, bears are unable to keep prices lower, and bulls then push prices back to the opening price.
Of course, a Doji could be formed by prices moving lower first and then higher second, nevertheless, either way, the market closes back where the time period started.
It is important to emphasize that the Doji pattern does not mean a reversal, it means indecision. A Doji can be viewed as a continuation pattern as well; If the Doji was found during periods of resting or consolidation after a significant move higher or lower, then the Doji doesn’t hold much significance, since the period itself is marked with insignificance and indecision. The Doji should appear at tops or bottoms to mean a reversal.
Types of Dojis:
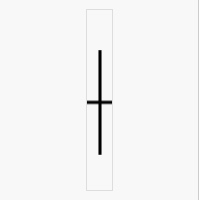
Neutral: Dojis form when the opening and closing prices are virtually equal. Alone, dojis are neutral patterns.
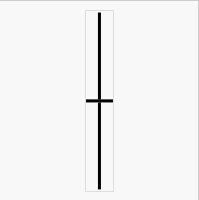
Long-Legged: This Doji reflects a great amount of indecision about the future direction of the underlying asset.
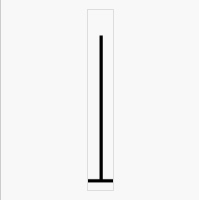
Gravestone: The long upper shadow suggests that the direction of the trend may be nearing a major turning point. It is formed when the opening and closing price of the underlying asset are equal and occur at the low of the day.

Dragonfly: The long lower shadow suggests that the direction of the trend may be nearing a major turning point. It is formed when the opening and closing price of the underlying asset are equal and occur at the high of the day.