 FXLORDS Increase Your Profits


In the 17th century, Japanese rice merchants invented the candlestick charting and nowadays, they are considered the number one tool when trading Forex. Below is a quick explanation to each Candle Stick along with a picture of how it looks like.
While the Japanese candlesticks charting and analysis was different from the US version initiated by Charles Dow around 1900, however they both rely on the following hypothesis
1. The way prices move – their behavior – in the financial market is more important than what can explain it (financial information economic releases, global news, etc).
2. All known information is reflected in the price of a specific currency at all times
3. Buyers and Sellers (Market Participants) act according to their expectations and their emotions.
4. Financial Markets fluctuates.
5. Prices should not be a reason for a devaluation of a currency.
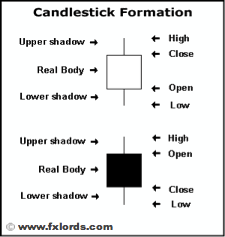
Candlestick Layout
When a charting system displays a Japanese Candlestick, the shape of the candle will be determined by:
1. The opening price;
2. The closing price;
3. Lowest price recorded during the same time period;
4. Highest price recorded during the same time period;
The Candlestick will be black when the closing price is lower than the opening price; i.e., analyzing a currency in a period in which this currency was in a falling trend. If the closing price is higher than the opening price i.e., the price of the currency is raising, then the Candlestick will have a white body.
Basic Patterns of the Japanese Candlesticks
![]() Black Candlestick With Long Body
Black Candlestick With Long Body
![]() White Candlestick with Long Body
White Candlestick with Long Body
![]() Black Candlesticks with a long upper Shadow and short lower Shadow
Black Candlesticks with a long upper Shadow and short lower Shadow
![]() Black Candlesticks with a short upper Shadow and long lower Shadow
Black Candlesticks with a short upper Shadow and long lower Shadow
![]() White Candlesticks with a long lower Shadow and short upper Shadow
White Candlesticks with a long lower Shadow and short upper Shadow
![]() White Candlestick with a short upper Shadow and a long lower Shadow
White Candlestick with a short upper Shadow and a long lower Shadow
![]() Normal Black Candlestick
Normal Black Candlestick
![]() Normal White Candlestick
Normal White Candlestick
![]() Black Marubuzo
Black Marubuzo
![]() White Marubuzo
White Marubuzo
![]() Black Spin Top
Black Spin Top
![]() White Spinning Top
White Spinning Top
![]() Hanging Man
Hanging Man
![]() Hammer
Hammer
![]() Inverted Hammer
Inverted Hammer
![]() Shooting Star
Shooting Star
![]() Doji
Doji
![]() Doju (Short Upper Shadow and long lower Shadow)
Doju (Short Upper Shadow and long lower Shadow)
![]() Dragon Fly Doji
Dragon Fly Doji
![]() Long Legged Doji
Long Legged Doji
![]() Gravestone Doji
Gravestone Doji